Electrocardiography (ECG) plays an important role in making the diagnosis of myocardial infarction. The technique is simple and informative. Modern portable devices allow you to take an ECG at home, in a factory health center. And in medical institutions, multi-channel technology has appeared that conducts research in a matter of minutes and helps in decoding.
An ECG during myocardial infarction serves as indisputable authoritative evidence for the doctor. Infarction-like changes are possible and do occur in acute pancreatitis and cholecystitis, but in such cases it is better to make a mistake and start treatment.
The nature of the ECG, reflecting the potential difference between healthy and diseased tissue, changes depending on the course of pathological process in tissues. Therefore, the results of repeated studies are important.
To decipher an ECG it is necessary to take into account many parameters
What information is included in the ECG technique?
100 years ago a recording method was developed electrical changes in the heart muscle. Electrocardiography is a method that allows you to record the action currents arising in the beating heart. In their absence, the galvanometer needle writes a straight line (isoline), and in different phases excitation of myocardial cells, characteristic teeth appear with an upward or downward direction. The processes occurring in the heart tissue are called depolarization and repolarization.
It will tell you more about the mechanisms of contraction, changes in depolarization and repolarization.
The ECG is recorded in three standard leads, three enhanced leads and six chest leads. If necessary, special leads are added to study the posterior parts of the heart. Each lead is fixed with its own line and is used in diagnosing heart damage. There are 12 in a complex ECG graphic images, each of which must be studied.
In total, there are 5 waves on the ECG (P, Q, R, S, T), an additional U rarely appears. They are normally directed in their own direction, have width, height and depth. There are intervals between the teeth, which are also measured. In addition, the deviation of the interval from the isoline (up or down) is recorded.
Each of the teeth reflects the functionality of a specific part of the heart muscle. The relationship between individual teeth in height and depth and direction is taken into account. The information obtained allows us to establish differences normal operation myocardium from an altered ECG various diseases.
Features of the ECG during myocardial infarction make it possible to identify and record signs of the disease that are important for diagnosis and subsequent therapy.
What indicates the period and duration of the disease
Acute myocardial infarction typical course goes through 3 periods of development. Each of them has its own manifestations on the ECG.

1 and 2 - indicate acute period, with 3 a zone of necrosis is formed, then gradual scarring is shown, 9 - complete recovery, 10 - a scar remains
Early period- the first 7 days, divided into the following stages:
- stage of ischemia (usually the first 2 hours) - appears above the focus high prong T;
- stage of damage (from a day to three) - the ST interval rises and the T wave moves down, it is important that these changes are reversible, with the help of treatment it is still possible to stop myocardial damage;
- formation of necrosis - an expanded and deep Q wave appears, R wave is significantly reduced. The focus of necrosis is surrounded by a zone of damage and ischemia. How large they are is indicated by the distribution of changes in different leads. Due to damage, the heart attack may increase. Therefore, treatment is aimed at helping the cells in these areas.
At the same time there are various disorders rhythm, therefore the ECG is expected to detect the first symptoms of arrhythmia.
Subacute - from 10 days to a month, the ECG gradually returns to normal, the ST interval drops to the isoline (the doctors at the functional diagnostics office say “sits down”), and signs of a scar form at the site of necrosis:
- Q decreases and may disappear completely;
- R rises to its previous level;
- only negative T remains.
The scarring period is from a month or more.
Thus, based on the nature of the ECG, the doctor can determine how long ago the disease appeared. Some authors distinguish separately the formation of cardiosclerosis at the site of a heart attack.
How is the location of a heart attack determined?
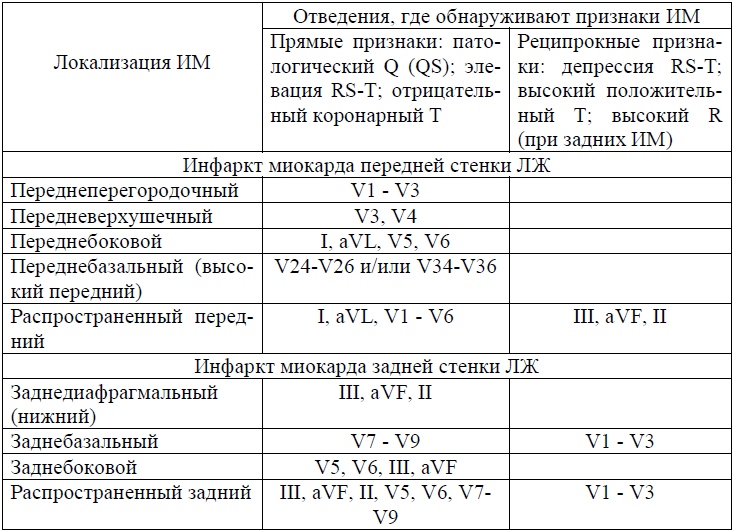
In most cases of ischemia, the infarction is located in the myocardium of the left ventricle; right-sided localization is much less common. Lesions on the anterior, lateral and posterior surfaces are distinguished. They are reflected in different ECG leads:
- with anterior infarction everything characteristic features appear in chest leads V1, V2, V3, 1 and 2 standard, in enhanced AVL;
- lateral wall infarction is rare in isolation, more often spreads from the anterior or posterior wall of the left ventricle, characterized by changes in leads V3, V4, V5, in combination with 1 and 2 standard and enhanced AVL;
- posterior infarction is divided into: lower (diaphragmatic) - pathological changes found in the enhanced leads AVF, the second and third standard; upper (basal) - manifested by an increase in the R wave in leads to the left of the sternum, V1, V2, V3, the Q wave is rare.
Infarctions of the right ventricle and atria are very rare; they are usually “covered” by symptoms of damage to the left side of the heart.

A 4-channel device is used, it calculates the rhythm frequency itself
Is it possible to find out how extensive the area of damage to the heart is?
The prevalence of a heart attack is judged by identifying changes in the leads:
- small focal infarction is manifested only by a negative “coronary” T and a shift in the ST interval, no R and Q pathology is observed;
- widespread infarction causes changes in all leads.
Diagnosis of the depth of myocardial necrosis
Depending on the depth of penetration of necrosis, the following are distinguished:
- subepicardial localization - the affected area is located under the outer layer of the heart;
- subendocardial - necrosis is localized next to inner layer;
- transmural infarction - affects the entire thickness of the myocardium.
When interpreting the ECG, the doctor must indicate the expected depth of the lesion.
Difficulties of ECG diagnostics
The arrangement of teeth and intervals is influenced by various factors:
- the patient's obesity changes the electrical position of the heart;
- cicatricial changes after a previous heart attack do not allow identifying new ones;
- conduction disturbance in the form of a complete block along the left bundle branch makes it impossible to diagnose ischemia;
- A “frozen” ECG against the background of a developing cardiac aneurysm does not show new dynamics.
Modern technical capabilities of new ECG devices allow you to simplify the doctor’s calculations (they are done automatically). Holter monitoring provides continuous recording throughout the day. Cardiac monitoring in the room with an audible alarm allows you to quickly respond to changes in heart rate.
The diagnosis is made by the doctor, taking into account clinical symptoms. ECG is an auxiliary method that can become the main one in decisive situations.
is a disease caused by blockage of the lumens of blood vessels supplying blood to the heart. The patient's condition depends entirely on timely diagnosis. The study is carried out by doctors using an ECG. During the procedure, the specialist receives notes on paper in the form of wavy lines showing the contraction and relaxation of the heart muscle.
Preparation for the procedure
The ECG procedure is carried out in medical institutions in specially equipped rooms. A stationary device for recording a cardiogram is usually located here, but in emergency cases portable devices can also be used if, for example, the patient called an ambulance to his home.
To obtain an accurate result, electrodes are attached to the person's chest and lower legs. To improve contact, the doctor applies a clear gel to the skin that increases current conductivity. It is also important that for highly accurate ECG readings the patient must get enough sleep. Since a cardiogram is most often prescribed in the morning, a person should avoid a heavy breakfast. If the ECG is performed in daytime, it is better for the patient to stop eating a couple of hours before the procedure.
Prohibited before ECG energetic drinks, tea, coffee, smoking, and some vasodilators, as readings may be inaccurate.
Before going to a session, you should not apply creams and lotions to your skin. Products can form a greasy film, which reduces the conductivity of the electrodes.
Carrying out an ECG during a heart attack
The ECG procedure is carried out in the following sequence:
- The patient takes off or unfastens his clothes to better attach the electrodes.
- Next, the person lies down on the couch.
- The electrode attachment points are degreased with alcohol. A special gel is applied.
- The doctor turns on the device and waits for the result within 15-20 minutes.
At the end of the session, the patient can wait for the cardiogram to be deciphered, or the results are transferred to his attending physician.
What electrodes and branches are used?
Electrodes are special sensors required when conducting an ECG for examination. chest person. They serve as a conductor of information about the state of the heart, which is subsequently displayed on the device’s monitor and on paper.
There are two types of ECG electrodes: reusable and disposable. The first type must be thoroughly disinfected after each session. This is necessary to avoid germs and bacteria. Disposable electrodes are convenient to use, as their use reduces examination time. Now almost every medical institution uses this particular variety.
To get more accurate ECG result leads are used that record the readings of the electrodes. IN modern medicine 12 leads are used, which are as follows:
- Standard. The number of leads is three.
- Strengthened. There are also three leads here.
- Breasts. Total number leads – six.
Standard or, as they are also called, bipolar leads are fixed on the human body with special clips on the ankles. One electrode is used as a ground, attached to the right leg.
Reinforced double-pole or single-pole taps form a six-axis system. Standard and enhanced abduction has an angle of 60 degrees. The axis is split in half by the heart's electrical center.
The chest tubes are attached to skin covering the patient with the help of six suction cups, which are connected to each other with a ribbon. The suction cups record impulses from the heart field. On a paper chart they are indicated by the letter "V".
Each of the six leads shows one or another part of the heart:
- Standard leads 1 and 2 report results from the anterior and posterior walls. Standard lead 3 is responsible for both readings.
- The lateral wall of the heart on the right is “aVR”.
- The lateral wall of the heart in front and on the left is “aVL”.
- Posterior inferior cardiac wall – “aVF”
- The right ventricle of the heart is “V1” and “V2”.
- The septum located between the ventricles is “V3”.
- Upper section hearts - “V4”.
- The lateral wall of the left ventricle of the heart in front is “V5”.
- The left ventricle of the heart is “V6”.

Study parameters
There are parameters that the attending physician relies on when examining a patient with using ECG:
- R-R-R gap. Normally, all spaces between the teeth have the same distance. But it happens that distances have different meanings. This may indicate heart disease: weakness sinus node.
- Heart rate. U healthy person equals from 60 to 90 beats per minute. With increased contractions - more than 90 beats / min - a diagnosis is made. If below 60 beats/min – .
- Atrial contraction - “P” wave. Placed in front of each "R" tooth. If the height and width of the wave are increased beyond 3 and 5 mm, respectively, this indicates thickening of the atria. Several saw-like teeth between the “R” vertices are myocardial flicker.
- Gap "P-Q". Located on the diagram between “P” and “Q”. If during ECG procedures showed too long intervals (more than 1 cm), which means the patient has atrioventricular heart block. A gap of less than 3 mm is WPW syndrome.
- "QRS". This complex is equal to the length of 0.1 sec. – 5 mm. Located after each “T” tooth. There is also a horizontal line. If the ECG showed an increase in the “QRS” distance in the diagram, it means that the patient has developed myocardial hypertrophy of both ventricles. If there are no gaps at all, it is ‒ .
- "Q" tooth. Points down. It is about 1/4 "R" deep. This parameter may be completely absent from the readings of a healthy person. A “Q” wave that is too deep and wide indicates myocardial infarction.
- "R" tooth. Present in all leads. Its height is 10-15 mm. The parameter may be of different heights in all leads, but if its values exceed the norm, it means that the person has hypertrophy of the left ventricle of the heart.
- "S" tooth. Also present in the leads. It has a pointed appearance with a depth of up to 5 mm. It should not exceed the reading of 20 mm.
- "S-T" segment. Lies on the diagram between the “S” and “T” teeth. It happens that on ECG segment deviated down or up more than 2 mm. This indicates that the patient has a myocardial infarction, or.
- "T" tooth. It has an arched appearance. Facing down. The depth of the tooth is less than 1/2 “R” tooth. If the cardiogram showed high and sharp “T” waves in the usual leads, this means that cardiac overload and coronary disease are observed. The “T” tooth merged with the “S-T” segment -.
Decoding the results
ECG interpretation is the process of evaluating the graph obtained on the tape after the patient has undergone the procedure. The specialist conducts full study teeth, segments and spaces, starting from the normal parameters.
The steps to recognize an electrocardiogram are as follows:
- The paper with the diagram is unfolded. It can be either narrow or wide and reach up to 20 cm. The readings consist of jagged lines. They run parallel. Every 1-2 cm the teeth are interrupted. Each graph is labeled with lead symbols - “aVR”, “aVL”, “V1”, “V2”, etc.
- One of the standard leads has the highest “R” wave. Typically, it is located on lead 2. The doctor takes measurements of the lumens at the “R-R-R” interval. The resulting value indicates the heart rate. A simple millimeter ruler is used here.
- The regularity of the heart rhythm is determined at the same “R-R-R” interval. They may be the same or different.
- Next, the doctor evaluates all the teeth.

It is necessary to monitor the length of the tape. It can be 25 or 50 mm/s. This is necessary for accurate calculations heart rate.
During work, the specialist is guided by standard research parameters:
- "P" wave. This indicator indicates the excited state of the atria. A positive result indicates sinus rhythm.
- Gap "P-Q". This parameter shows the time spent on an impulse passing through the muscles of the atria and ventricles of the heart.
- "QRS". This is a parameter of the electrical activity of the ventricles.
- "Q" tooth. Shows an impulse in the interventricular space on the left.
- "R" tooth. Speaks of excitation of the cardiac chambers from below.
- "S" tooth. End parameter excited state lower left chamber of the heart.
- "S-T" segment. This interval shows a sign of excitation of both ventricles of the heart.
- "T" tooth. Informs the specialist about the restoration of the electrical potential of the lower chambers of the organ.
- "Q-T" interval. This indicates the contraction of the ventricles. The parameter is constant and characteristic of gender and age.
- "T-R" segment. Indicates relaxation of the atria and ventricles of the heart.
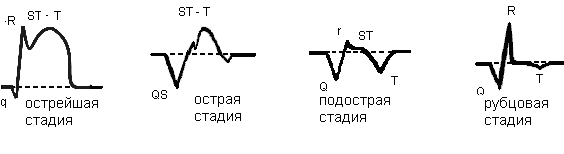
Stages of infarction on ECG
There are four main stages of the disease, each of which has its own signs on the ECG tape. A specialist, based on the indications, can accurately determine at what stage the disease is:
- Developing stage of the disease - from 0 to 6 hours. On the “S-T” electrocardiogram, the segment is located above the isoline and merges with the “T” wave. The “R” wave is higher than normal, and the “Q” wave is low.
- Acute stage – from 6 hours to 7 days. The ECG shows a "T" wave in a negative position. The “R” wave has a reduced amplitude. The “Q” wave deepens more than normal.
- Healing myocardial infarction. From 7 to 28 days. The cardiogram indicates a negative T wave and the approach of the S-T segment to the isoline.
- Healed heart attack From 29 days to several years. The diagram shows the "Q" wave in a stable position. The amplitude of the “R” wave is reduced, the “T” wave has a positive parameter, and the “S-T” segment is set on the isoline.
ECG changes in various types of myocardial infarction (photo)
On an ECG, myocardial infarction can manifest itself in completely different ways. It depends on the area of the organ affected. There are two types, each of which has its own various signs and manifestations on the electrocardiogram:
- .
It can be transmural, where the affected area of the organ covers the entire wall of the heart. With this type of ECG there is no “R” wave, the “Q” wave is widened. The “S-T” segment and the “T” wave merge together in the infarct area and are located much above the line. The “S-T” segment is located below the isoline, and the “T” wave has negative indicators.
Also, Q infarction can be subepicardial. It is characterized by the location of the affected area on the outer shell of the organ. The diagram shows a reduced "R" wave and an enlarged "Q" wave. The “S-T” segment is located above the infarction area, but much lower than the other lines. “T” tooth is negative. - .
Divided into intramural and subendocardial. In the first case, the muscle layer is affected. It is characterized by the absence of pathologies in the “Q” and “R” on the ECG, the “S-T” segment without changes and the “T” wave with a negative indicator.
In the second case, where the affected area is inside the heart membrane, the ECG tape shows the absence of pathologies in the “R”, “Q” and “T” waves. The “S-T” segment is located below the line.
Data about the disease are recorded by electrodes placed on the human body. To detect heart lesions, sensors are placed in different ways. The readings depend on this.
Damage to the anterior wall
For measurements the following are used:
- Standard leads 1, 2, as well as from the left hand. Characteristically: the “Q” wave is deep, much lower than normal, the “S-T” segment and the “T” wave merge, the “T” has a positive location.
- Lead 3 and from the right limb. Characteristically: “S-T” is located below the line and turns into a “T” wave, which is in a negative value.
- Chest leads from 1 to 4. Characteristically: the “R” wave is missing in the diagram. “QS” appears in its place. And the “S-T” gap rises above the isoline by 3 mm.
- Chest from 4 to 6, as well as from the right hand. Characteristically: the “T” tooth is flattened, the “S-T” segment is slightly shifted downwards from the norm.

Damage to the back wall
The following leads are used:
- Standard leads 2, 3, as well as from the right limb. Characteristic: deep position of the “Q” tooth and its expansion. The “T” wave is positive and is in contact with the “S-T” segment at the level of the isoline.
- Standard lead 1. Characteristic: “S-T” gap descends below the line.
- Chest leads from 1 to 6. Characteristic: the location of the “S-T” segment is below the isoline, the “T” wave is distorted to a minus value.

For detection, standard lead 3, lead from the left arm, right limb, as well as chest electrodes 5 and 6 are used. Characteristically: the “Q” tooth is very wide and deep. The “S-T” gap is increased, and the “T” tooth is connected to the “S-T” segment.

Standard leads 1, 3, left arm leads and right leg. Also chest leads from 3 to 6. Characteristic: « Q" in the diagram is an expanded and deep tooth, the "S-T" segment rises above the isoline and merges with the "T", which has a plus value.

The study uses standard lead 1, as well as:
- Left arm lead, thoracic leads 1 and 2 (anterior septal region). Characteristic: tooth « Q" is deepened, and the "S-T" gap, on the contrary, is raised above the standard. “T” wave is positive.
- Thoracic leads 1 and 2 (posterior region of the septum). Characteristically: there is an increase in the “R” wave, “S-T” is on the isoline or below, “A-V” blockade of any degree is present.

These include:
- disruption of blood flow in the myocardium, which occurs in parallel with the configurations of His bundle block;
- heart attacks on early stages;
- changes and disturbances in the heart muscle at scar sites.

This heart attack is difficult to diagnose. Therefore, deciphering the patient’s ECG should be done by an experienced specialist who knows the intricacies of the procedure.
Can an ECG fail to show a heart attack?
An ECG is a universal way to diagnose myocardial infarction. In 80% the method gives positive result. However, in 20% of cases the disease is not detected, as it can camouflage itself. In such cases, the patient should undergo tests and undergo additional procedures to fully confirm the diagnosis.
An electrocardiogram is a safe and effective method for diagnosing myocardial infarction. The procedure, which does not take much time, is carried out by doctors in any medical institution. An ECG can be prescribed to people of different ages and even pregnant women, as it has no contraindications.
Currently, myocardial infarction is a fairly common disease. If its initial manifestations are confused with angina pectoris, this can lead to sad consequences and often death. To avoid such a development of events, it is necessary to call a doctor as soon as possible. An ECG during myocardial infarction can sometimes save life and return the patient’s life to its usual rhythm.
ECG performance
A cardiogram for a heart attack is the “gold standard” for diagnosis. The greatest information content occurs in the first hours after the development of the pathological focus. It is at this time during the recording that the signs of myocardial infarction on the ECG are especially acute as a result of the cessation of blood saturation of the cardiac tissues.
The film on which the result of examination of an already developed pathology is recorded reflects the initial disturbance of blood flow, unless, of course, it was formed during the procedure. This is manifested by an altered ST segment in relation to the lines of various leads, which is related to the need for a typical manifestation:
- impaired support through cardiac tissue, which is formed after complete cell death or necrosis;
- changed electrolyte composition. After a heart attack, there is extensive release of potassium.
Both processes require a certain amount of time. Based on this, a heart attack usually appears on the ECG 2–3 hours after the onset of the infarction. The changes are associated with the following processes occurring in the affected area, resulting in its division: necrosis of the myocardium (necrosis), tissue damage, which can then turn into necrosis, insufficient blood supply, which can end with timely treatment full restoration.
Photo of myocardial infarction
Signs of a heart attack on the ECG over the area of the formed pathological zone are as follows: the absence of an R wave or a significant decrease in its height, the presence of a deep pathological Q wave, elevation of the S-T segment above the isoline, the presence of a negative T wave. On the side opposite to the infarction zone, the presence of an S-T segment is determined, which is located below the isoline level.
It is important to consider that, based on the size of the disturbed blood flow and its location relative to the membrane of the heart muscle, diagnostics can register only some of these disorders.
As a result, found on ECG signs give the opportunity:
- determine the presence of a heart attack;
- locate the area of the heart where the heart attack occurred;
- determine how long ago the infarction occurred;
- decide on further treatment tactics;
- predict the possibility of further complications and the risk of death.
What does a heart attack of different time periods look like on an ECG?
Changes in the ECG appear in accordance with how long ago the pathology developed. This information is extremely important for further treatment. The most striking display occurs in infarcts that have a large volume of affected tissue. During the study, it is determined next stages:
- acute type of disease has a time period from several hours to 3 days. On the ECG it looks like a high location of the S-T segment relative to the isoline located above the affected area. Due to this, during diagnostics it is impossible to see the T wave;
- subacute stage lasts from the first day to 3 weeks. The cardiogram shows a slow decrease in the S-T segment to the isoline. If the isoline is reached by the segment, then this stage is over. Also during the procedure, negative T is determined;
- scarring stage, in which a scar is formed. This stage lasts from several weeks to 3 months. During this period, the T wave gradually returns to the isoline. It can be positive. The increased height of the R wave is determined on the tape. If the Q wave is present, its pathological size decreases.

How are heart attacks of different sizes determined?
During a cardiogram, it is possible to identify pathological foci depending on the affected area. If it is located close to the outer wall of the heart tissue, an anterior type of infarction develops, which can cover the entire wall blood vessel. This will disrupt the blood flow of a large vessel. A small lesion affects the end of arterial branches. There are the following types pathological lesion.
Large-focal
There are two options. Transmural type, in which the affected area covers the entire thickness of the myocardial wall. In this case, the ECG shows the absence of the R wave, the expansion of the deep Q wave. As a result of the sawing of the S-T segment high above the isoline, the T wave merges with the infarction zone. In the subacute period, a negative T wave is determined.
Large focal lesion of the subepicardial type is characterized by the location of the affected area close to outer shell. In this case, a reduced R wave and an increase and expansion of the Q wave are recorded. Complex S-T located above the area of infarction, below the lines of other leads. Negative T is determined in the presence of a subacute type.
Finely focal
Subendocardial infarction is defined by damage to the area near the inner lining of the heart. In that ECG case will show smoothing of the T wave. Intramural is characterized by a lesion in the muscle layer. In this case, no pathologies of the Q and R waves are detected.

Variation depending on the location of the pathology
To detect the presence of changes, 12 electrodes must be installed. If there is even the slightest suggestion of a heart attack, then using fewer electrodes is prohibited. Based on the location of the pathological focus, the cardiogram is recorded in different ways.
There are different localizations of the pathological focus:
- anterior infarction is characterized by the departure from the right arm of a deep Q wave, from the right leg - the S-T segment, turning into a negative T wave. Sensors emanating from the chest area record the absence of an R wave, from the right hand - a displacement of the S-T segment;
- lateral infarction is represented by changes emanating from the left arm, right leg in the form of an expanded Q wave, an increase in the S-T segment;
- Q infarction is characterized by changes emanating from the chest electrodes in the form of a significant elevation of the S-T segment, positive T;
- the posterior one shows an altered state emanating from the right leg in the form of a wide Q wave, a positive T wave, which is marked by deformation;
- infarction of the interventricular septum is represented by changes from the left hand, chest area. In this case, the lower S-T segment, a positive T wave is determined, Q deepens;
- Right ventricular infarction on the ECG is quite difficult to determine as a result of the common source of blood flow. Its detection requires the application of additional electrodes.

Is it always possible to determine pathology?
Despite the high effectiveness of the method, there are some difficulties that make it difficult to decipher in determining a heart attack using an electrocardiogram. These include excess weight investigated, which affects the conductivity of the current, detection of new scars is difficult if there are scar changes on the heart, if the conductivity of the block is disrupted, old aneurysms of the heart muscle make it difficult to diagnose new dynamics.
However, provided that modern devices are used, it is possible to carry out automatic calculations of infarction lesions. If you carry out daily monitoring, you can track the patient’s condition throughout the day. ECG is the first method of detecting a heart attack. With its help, pathological foci can be detected in a timely manner, which increases the chance of recovery.
I. Mogelwang, M.D. Cardiologist of the intensive care unit of the Hvidovre Hospital 1988
Coronary heart disease (CHD)
The main cause of IHD is obstructive damage to the main coronary arteries and their branches.
The prognosis for IHD is determined by:
number of significantly stenotic coronary arteries
functional state of the myocardium
The ECG provides the following information about the state of the myocardium:
potentially ischemic myocardium
ischemic myocardium
acute myocardial infarction (MI)
previous myocardial infarction
MI localization
MI depth
MI sizes
Information that is relevant for treatment, control and prognosis.
Left ventricle
In IHD, the myocardium of the left ventricle is primarily affected.
The left ventricle can be divided into segments:
Septal segment
Apical segment
Lateral segment
Posterior segment
Lower segment
The first 3 segments make up the anterior wall, and the last 3 segments make up the posterior wall. The lateral segment may thus be involved in anterior wall infarction as well as posterior wall infarction.
SEGMENTS OF THE LEFT VENTRICLE
ECG LEADS
ECG leads can be unipolar (derivatives of one point), in which case they are designated by the letter “V” (after the initial letter of the word “voltage”).
Classic ECG leads are bipolar (derivatives of two points). They are designated by Roman numerals: I, II, III.
A: reinforced
V: unipolar lead
R: right (right hand)
L: left ( left hand)
F: leg ( left leg)
V1-V6: unipolar chest leads
ECG leads reveal changes in the frontal and horizontal planes.
|
Hand to hand |
Lateral segment, septum |
|
|
Right hand -> left foot |
||
|
Left hand -> left foot |
Lower segment |
|
|
(Enhanced unipolar) right hand |
Attention! Possible misinterpretation |
|
|
(Enhanced unipolar) left hand |
Lateral segment |
|
|
(Enhanced unipolar) left leg |
Lower segment |
|
|
(Unipolar) at the right edge of the sternum |
Septum/Posterior segment* |
|
|
(Unipolar) |
||
|
(Unipolar) |
||
|
(Unipolar) |
Top |
|
|
(Unipolar) |
||
|
(Unipolar) along the left middle axillary line |
Lateral segment |
|
|
* - V1-V3 mirror image of changes in the posterior segment |
||
ECG leads in the frontal plane
ECG leads in the horizontal plane


MIRROR IMAGE(with a specific diagnostic value detected in leads V1-V3, see below)

Cross section of right and left ventricles & Left ventricle segments:
Relationship between ECG leads and left ventricular segments

Depth and dimensions
QUALITATIVE ECG CHANGES

QUANTITATIVE ECG CHANGES

LOCALIZATION OF INFARCTION: ANTERIOR WALL

LOCALIZATION OF INFARCTION: POSTERIOR WALL

V1-V3; COMMON DIFFICULTIES

Infarction and bundle branch block (BBB)
LBP is characterized by a wide QRS complex (0.12 sec).
Blockade right leg(LBP) and left bundle branch (LBN) can be distinguished by lead V1.
RBP is characterized by a positive wide QRS complex, and LBP is characterized by a negative QRS complex in lead V1.
Most often, the ECG does not provide information about a heart attack in LBBB, unlike in LPN.

ECG changes in myocardial infarction over time

Myocardial infarction and silent ECG
Myocardial infarction can develop without the appearance of any specific changes on the ECG in the case of LBBB, but also in other cases.
ECG options for myocardial infarction:
subendocardial MI
transmural MI
without specific changes
ECG for suspected coronary heart disease
Specific signs of coronary heart disease:
Ischemia/Infarction?
In case of a heart attack:
Subendocardial/transmural?
Localization and sizes?
Differential diagnosis

ECG DIAGNOSTICS KEY FOR CORONARY HEART DISEASE
|
PD KopT - suspicion of KopT |
||||||||||||
|
States: |
ECG symbols: |
|
1. Anterior segment ischemia 2. Ischemia of the lower segment 3. Subendocardial inferior MI 4. Subendocardial infero-posterior MI 5. Subendocardial infero-posterior-lateral MI 6. Subendocardial anterior infarction (common) 7. Acute inferior MI 8. Acute posterior MI 9. Acute anterior MI 10. Transmural inferior MI 11. Transmural posterior MI 12. Transmural anterior MI (widespread) (septal-apical-lateral) * The mirror pattern (zer) of ST G is visible not only with posterior MI, in this case it is called reciprocal changes. |
For simplicity, this is released in context. The mirror image of ST G and ST L cannot be distinguished. To establish a diagnosis of myocardial infarction, special equipment is used - an electrocardiograph (ECG). The method by which a fact is established
Myocardial infarction type 2 – spasms and dysfunction
 circulatory system
 Features of the blood supply to the myocardium An electrocardiogram or ECG shows a heart attack, which can happen for a variety of reasons. First of all, I would like to note the mechanics of blood flow. The myocardium is supplied with blood from the arteries, which begin from the expanding initial part of the aorta, called the bulb. They fill with blood in the diastole phase, and in another phase - systole - the blood flow ends by closing
aortic valves , which come into action under the contraction of the myocardium itself. From the left coronary (coronary) artery there are 2 branches that go
- common trunk
- to the left atrium. They are called the anterior descending and circumflex branches. These branches supply the following parts of the heart:
- left ventricle: posterior and anterolateral parts;
- left atrium;
- from the right ventricle partially the anterior wall;
2/3 of the interventricular septum; AV node.(PK) originates from the same place as the left one. Then it goes along the coronary groove, passing it and going around the right ventricle (RV), passes to the posterior cardiac wall and feeds the posterior interventricular groove.
The blood flowing through this artery allows the following areas to function:
- right atrium;
- back wall pancreas;
- part of the left ventricle;
- 1/3 of the interventricular septum (IVS).
Diagonal “highways” of blood depart from the right VA, which feed parts of the heart:
- anterior wall of the left ventricle;
- 2/3 MZhP;
- left atrium (LA).
In half of the cases, another diagonal branch departs from the coronary artery, and in the other half, a median branch.
There are several types of coronary blood supply:
- In 85 percent of cases, the posterior wall is supplied from the right coronary artery.
- 7-8% - from the left coronary artery.
- Uniform blood supply from the right and left coronary arteries.
When correctly “reading” a cardiogram obtained during a myocardial infarction, you need to discern all the signs, understand the processes taking place in the heart, and accurately interpret them. There are two types of signs of a heart attack: direct and reciprocal.
Direct signs include those recorded by an electrode. Reverse signs(reciprocal) are the opposite of direct signs and record necrosis of the reverse cardiac wall. When analyzing a patient's electrocardiogram, it is important to know what a pathological Q wave and pathological ST segment elevation are.
The Q wave is called pathological in the following conditions:
- Present in leads V1-V.
- In chest leads V4-V6 is 25 percent higher than the height of R.
- In I and II it is 15% higher than R.
- In III the excess of R is 60%.
- In all V leads, the segment is 1 mm higher from the isoline, except for the chest lead.
- In chest leads 1-3, the segment is exceeded by 2.5 mm from the isoline, and in leads 4-6 by a height of more than 1 mm.
To prevent the expansion of the area of necrosis, timely and constant diagnosis of myocardial infarction is necessary.
 The table shows what the list of data on the work of the heart muscle looks like and a description of the stage of necrosis for them
 Myocardial infarction on ECG: interpretation
 The photo shows an ECG for myocardial infarction
 To decipher the data obtained by the cardiograph, you need to know certain nuances. On the recorded sheet of paper, segments with and without teeth are clearly visible. They are designated by Latin letters, which are responsible for the data taken from one of the sections of the heart muscle. These waves are ECG indicators and criteria for myocardial infarction.
- Q – shows irritation of ventricular tissues;
- R – apex of the heart muscle;
- S – allows you to analyze the degree of irritation of the walls of the interventricular septum. Vector S is directed inversely to vector R;
- T – “rest” of the ventricles of the heart muscle;
- ST – time (segment) of “rest”.
To obtain data from different parts of the heart muscle, as a rule, 12 electrodes are used. To register a heart attack, electrodes installed on the left side chest (fixed to leads V1-V6).
When “reading” the resulting diagram, doctors use a technique for calculating the length between vibrations. Having received the data, you can analyze the rhythm of the heartbeat, with the teeth indicating the force with which the heart contracts. To determine violations, you need to use the following algorithm:
- Analyze data on the rhythm and contractions of the heart muscle.
- Calculate the length between vibrations.
- Calculate the electrical axis of the heart.
- Study the complex of indications under the values of Q, R, S.
- Carry out an analysis of the ST segment.
Attention! If an attack of myocardial infarction without ST-segment elevation occurred, the cause could be ruptures of the formed fatty plaque in the blood vessel. This leads to active blood clotting with the formation of a blood clot.
Signs of myocardial infarction on ECG
Myocardial infarction has manifestations in varying degrees difficulties. There are 4 types (stages) of myocardial infarction, which can be traced on the patient’s cardiogram.
The most acute stage
 Manifestations of the onset of necrosis can be understood by chest pain
 The first stage can last up to three days, being the most acute in the entire course of the disease. In the initial stages of the first stage of myocardial infarction, necrosis is formed - a damaged area, which can be of two types: transmural and intramural myocardial infarction. The ECG during this period contains the following changes in heart function readings:
- The ST segment is elevated, forms a convex arc - elevation.
- The ST segment coincides with the positive T wave - monophase.
- Depending on the severity of necrosis, the R wave will decrease in height.
And reciprocal changes, accordingly, consist in an increase in the R wave.
Acute stage
 Varieties of stages of heart attack: from the second, longer stages of the disease begin
 After this comes the second stage, which can last 2-3 weeks. The focus of necrosis decreases. At this time, ECG signs of myocardial infarction and ischemia appear due to dead cardiomyocytes during the acute period of myocardial infarction. The following readings from electronic sensors are noted on the ECG during the acute period:
- The ST segment is closer to the isoline compared to the data obtained in the first stage, but it is still above it.
- QS and QR pathologies are formed with trans- and non-transmural damage to the heart muscle, respectively.
- A negative symmetrical T wave is formed.
Reciprocal changes are opposite: the T wave increases in height, and the ST segment rises to the isoline.
Subacute stage of myocardial infarction
The duration of the third stage in sequence is even longer - up to 7-8 weeks. At this time, the disease begins to stabilize, necrosis is observed in its true size. In this period, the indications of a heart attack on the ECG are as follows:
- The ST segment is aligned with the contour line.
- QR and QS pathologies persist.
- The T wave begins to deepen.
Scarring
The last stage of myocardial infarction, starting at 5 weeks. The stage received this name because a scar begins to form at the site of necrosis. This scarred area has no electrical or physiological activity. Signs of scarring are displayed on the ECG by the following signs:
- Pathological Q wave present. It is worth remembering that with trans- and non-transmural ailments, pathologies of the QS and QR complexes are observed, respectively.
- The ST segment is aligned with the contour line.
- The T wave is positive, reduced or leveled (smoothed).
During this period, the pathological waves may completely disappear and the ECG will not be able to detect the infarction that has occurred.
How to recognize the exact location of necrosis
 Localization will be shown by ECG
 To identify the location of necrosis (myocardial infarction) on an ECG, it is not necessary to conduct additional examinations. A cardiogram for a heart attack will be able to provide sufficient information to identify the suspected area. In this case, the cardiogram of the heart will be slightly different.
The following factors also influence the readings of electrical equipment:
- time of onset of the disease;
- depth of lesion;
- reversibility of necrosis;
- localization of myocardial infarction;
- associated disorders.
Classifying infarction by location, we can distinguish the following: possible cases course of the disease:
- anterior wall infarction;
- back wall;
- septal;
- side;
- basal.
Defining and classifying the affected area helps to assess the complexity and identify complications of the disease. For example, if the lesion affected top part heart muscle, it will not spread, since it is isolated. Damage to the right ventricle is very rare and has its own characteristics in treatment.
For example, an anteroseptal infarction on an ECG looks like this:
- Pointed T waves in leads 3-4.
- Q – 1-3.
- The ST segment has a rise in segments 1-3.
WHO classification of myocardial infarction
 The methods and duration of treatment depend on the degree of complexity of the disease.
 To classify myocardial infarction, the WHO classification is used. What distinguishes these standards is that they are used only for the classification of large-focal injuries, therefore, according to these standards, mild forms of the disease are not considered.
According to this classification, the following types of damage are distinguished:
- Spontaneous. Occurs due to destruction cholesterol plaque, tissue erosion.
- Secondary. Oxygen deficiency caused by blockage of a blood vessel by a thrombus or spasm.
- Sudden coronary death. At this heart attack There is a complete disruption of the contractility of the heart with its arrest.
- Percutaneous coronary intervention. The cause is surgical intervention leading to damage to blood vessels or the heart muscle.
- Stent thrombosis.
- Complication of aortic bypass surgery.
Using this qualification, it is possible to determine the degree of necrosis and the causes that gave rise to it. As a rule, it is used for complex forms of heart attack, since the lungs can be determined by the timing of the lesion and location.
Classification by term
To identify the complexity of the lesion, it is necessary to correctly determine the timing of the disease. As a rule, this is initially determined from the patient’s medical history, which contains the call card, and after an initial examination. But they only allow you to provide first aid and perform procedures until the diagnosis is fully identified.
Stages of heart attack by duration:
- Premonitory. Pre-infarction state, when symptoms begin to appear. The duration can reach up to a month.
- The sharpest. During this period, the disease progresses with the formation of necrosis. Duration about 2 hours.
- Spicy. Necrosis develops within 10 days, which can occur with complete necrosis of some areas.
- Subacute. Until the fifth week from the onset of the disease. At this stage of the disease, necrotic areas begin to scar.
- The post-infarction period proceeds with the adaptation of the heart muscles to new operating conditions and with the complete formation of a scar. It can last up to six months.
After rehabilitation period passed, changes on the ECG disappear, signs of chronic ischemia remain.
